Graceful exit with Python multiprocessing
I often use the Process/ThreadPoolExecutor from the concurrent.futures standard library module to parallelize workloads,
but have trouble exiting gracefully as the default behavior is to finish all pending futures (either using as_completed or during exit of the with block).
I want to be able to:
- Cancel pending jobs
- Not do the work to submit all tasks at once (this might involve some API calls or whatever for 1M files that I'd rather not do all at once)
- Cancel running jobs if necessary
- Implement more sophisticated retry handling if desired
To do that, I'll build a simple demonstration that exhibits these behaviors.
Benchmarking Postgres timeseries queries
In my domain, the energy world, we work a many with timeseries. Generally, these arrive in batches where one day (in localtime) always arrives at once and there can be multiple versions of the same data. A normal portfolio has many thousands of assets. Often one wants to aggregate these timeseries over a subset of assets, for some time range. This is not a trivial thing to do in a row-oriented database like Postgres. Below we will explore some methods to store this data, and benchmark different queries to get the same result.
Applying optical flow to Sentinel-2 imagery
There are a lot of satellites gathering a lot of imagery of the earth, day in day out. The government-subsidized and freely available data from Landsat-8 and Sentinel-2 missions have a maximum spatial resolution of 15m (Landsat-8 panchromatic band) and 10m (Sentinel-2 R/G/B/NIR bands), respectively. Free imagery at such a high resolution is pretty cool!
Sentinel-2 has a revisit time of ~5 days, meaning it will view the same plot of land at about the same angle every 5 days. However, the pointing accuracy is never perfect, so the pixels are never exactly in the same place. The question in my mind is: can we use multiple images over time to effectively do "superresolution"?
Getting data
I'm using Level-2A data as this gives me Bottom-of-Atmosphere (BOA) reflectance, while the Level-1C product gives Top-of-Atmosphere reflectance. The TOA reflectance is basically what the satellite "sees", but can be much more "hazy" by going back up through the atmosphere. The BOA reflectance is what we'd estimate the surface reflects, which makes it look less "hazy" and will hopefully reduce differences in images a bit.
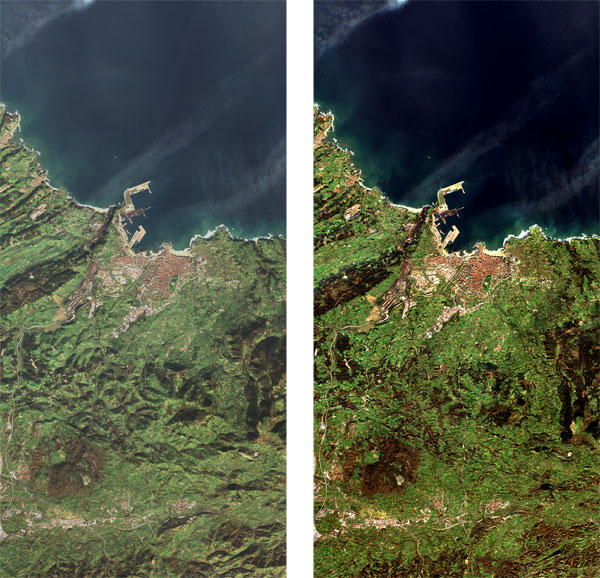
Image from ESA
Speed and quality of geospatial data interpolation
There is a central difficulty in processing geospatial data, which is that the earth is round and our screens are flat. To "fix" this we use map projections, which are always a tradeoff.
If we want to do meaningful machine learning on geospatial data, we'll often need to transform it to something rectangular, as that allows us to do 2D convolutions and other magic. (Spherical and graph convolutions might be interesting as well.)
To choose a good map projection, we need to know that a projection can have different properties:
- Conformal: Draw a 90° cross on the earth and in your map it will always be at 90°
- Equal-area: The area of any piece of land is the same on earth as on your map
- Equidistant: Only interesting if you want to measure distance from a point or line
A map cannot be conformal and equal-area at the same time. A map can be equidistant and equal-area. Most maps are "compromise" maps where they have none of these properties but try to make a good compromise for a certain usecase.
If we are doing convolutions on geospatial data, e.g. recognizing hurricanes, we might want to use a conformal projection so that local shapes like the eye of a hurricane are mostly correct. If we limit the projection to a small area, we can have a quite low-distortion view of the earth. For example, the mercator projection seems suitable, especially its transverse variant (as used in the UTM system), as that works better for higher latitudes. A TM projection over central europe can be defined in terms of proj4 string as follows:
# See https://proj.org/operations/projections/tmerc.html
>>> from pyproj import CRS
# Central meridian is at 15deg East
>>> crs_tmerc = CRS.from_proj4("+proj=tmerc +lon_0=15")
We can use this projection to calculate the new grid in terms of old coordinates, and do the resampling. This is more complicated than resampling a simple image, as we don't take e.g. every 5th pixel (simple strided indexing) but are reprojecting to a completely different, warped space. I'm especially interested in how to do this interpolation in a fast way, and what the differences in quality are between various methods.
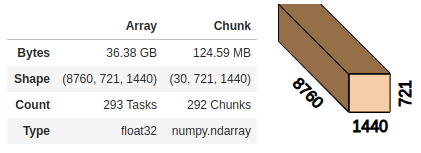
Array databases 1: Candidates and comparing xarray/Dask
Big data is big at the moment. Everyone and their nephew are aware of data and its superpower. However, most of this is data valuable for businesses, data that can be represented in a dataframe a.k.a. database table.
| id | customer_id | product_id | order_amount | profit |
|---|---|---|---|---|
| 1 | 5340 | 12408 | 3 | 100 |
| 2 | 235 | 9401 | 8 | 90 |
Business data
To store this data, we have great relational databases, columnar databases, managed columnar autoscaling databases, etcetera. We can even build streaming pipelines to reach the ultimate goal of optimizing clickthrough rates in realtime.
Science data, however, does not always fit in this paradigm. More often than not, this data is best represented as large multi-dimensional arrays, especially earth observation and weather/climate simulation data. Some argue that with the advent of machine learning and data science, more and more of this computation will move into the database, and this computation is best defined on arrays.
Interesting data
We are not completely at a loss, luckily, as there are some solutions to querying this kind of data effectively. In this series we will look at multiple array databases, and do a similar set of operations with them, to get a feeling for how they work, and what their strong and weak points are.
After a bit of searching I compiled this list of interesting options for storing array data:
- Store as file or blobs, query with xarray + Dask (this post)
- SciDB, a custom array database (future post)
- PostGIS raster, support for rasters in PostGIS/Postgres (future post)
- TileDB, a modern way to analyze array data using Dask as compute backend and blob storage to store array (meta)data (future post)
- rasdaman, the original array database, seems to have been around for a while (possibly future post)
We'll use temperature data from the ERA5 reanalysis as representative usecase. I intend to make a comparison post at the end of this series going over some of the strong points and weaknesses of the different systems.
Playing with Postgres NOTIFY/LISTEN using Python asyncio and psycopg2
Everything is easier when a (web) application can run in just one thread. No need to communicate with other threads, no need to keep data in sync, you can do whatever and get away with it. Unfortunately, today's systems need to be distributed to be fault-tolerant, and (auto)scale to multiple threads/processes to handle higher workloads. Depending on the architecture this can bring additional requirements, like some form of inter-process communication.
An example of this is a classic REST API. In one thread it's fine, and it can scale to many processes easily because a REST API is naturally stateless; it does not matter which instance receives the request, it will be handled the same way. When we introduce a kind of streaming pub/sub updates like Server-Sent Events (SSE) or WebSockets however, this abstraction suddenly breaks, as the connection persists to only one instance and there is no way to communicate between instances, for example to send a chat message from user A to user B if they are both connected to different instances of the same app.
One way to solve this is by placing a GRIP proxy in front of it, that can terminate the SSE/WebSocket connection. Relatively simple and our abstraction works again. Another way to solve this is to stay with terminating the streaming connection in the web application instance, but have a backend pub/sub system like Redis to communicate between instances.
In place of Redis we can use Postgres, as it also contains NOTIFY/LISTEN (pub/sub) functionality. This saves us from having to set up yet another service with credentials, secure it properly etc.
In this article I'll explore how to use it, and how we can use it from Python asyncio. In a future post I hope to implement this for Django REST Framework to enable easy streaming create/update/delete notifications.
You can run this notebook in Colab! Simply download here and upload to Colab.
Exploring global weather data
Machine learning is being used on many kinds of data, being especially successful in areas with lots of data like vision. However, we see quite little of it in meteorology, where big Numerical Weather Prediction simulations run daily that try to simulate the entire atmosphere up to weeks ahead. This takes supercomputers and lots of tweaking of the parameters to achieve good results.
Funny enough we know from The Bitter Lesson that data + compute always wins. Currently we take the approach of putting more and more human knowledge (physics, approximations) into these NWP models, and by and large this is a big success story.
The question is, however, not if but when we will hit the limit where data + compute + more general ML methods will beat these amazing numerical simulations.
In this post we will do some exploratory analysis of the NOAA "Global Surface summary Of the Day" dataset, which is available as BigQuery public dataset.
You can run this notebook in Colab! Simply download here and upload to Colab.